Have a question?
Message sent Close

Organizations collect huge amounts of data every day. But collecting data is not the same as making sense of it. What tools help you turn raw numbers into useful information? To understand customer behavior, you need systems that can transform scattered data into clear, usable metrics.

Salesforce Data Cloud uses two main engines: Calculated Insights and Streaming Insights. Each engine processes data in a unique way and answers different business questions. For example, Calculated Insights look for long-term patterns in your data. Streaming Insights, in contrast, react instantly to new events as they happen. Essentially, the engine you choose will impact your business strategy and your budget.

What is the best way to process this information? In this guide, you will explore the main functions of both engines. You will see how each tool works. The guide covers when to use each engine and how they fit into your data strategy and budget. Along the way, you will find tips to help you avoid common mistakes. By breaking complex ideas into easy-to-understand parts, this guide helps you choose the right approach.

Picking the wrong processing engine can slow down your system and add costs you don’t need. By the end of this post, you will know how to match each insight engine to the right business problem. This helps you avoid common pitfalls. It also means your data processes stay efficient and cost-effective.

calculated and streaming insights

What are Calculated Insights?

So, how do you determine a customer’s total value over several years? This is where Calculated Insights come in. Calculated Insights are built to define who a customer is by analyzing long-term historical data. In simple words, they process large batches of information to build a complete profile of a person. For example, the system combines years of purchases, support tickets, and online interactions. This helps answer questions about a customer’s relationship with your brand. Instead of guessing, you get a clear and practical view of customer trends.

These insights examine your entire data estate. They pull information from Unified Profiles, Data Model Objects (DMOs), and Data Lake Objects (DLOs). Because they handle so much data, Calculated Insights run on a fixed schedule—often once daily. Scheduling is different from how real-time engines work. Calculated Insights are not made for quick, split-second choices. Instead, you use them for analysis and planning over the long term.

Two Approaches to Create Calculated Insights: SQL or Canvas

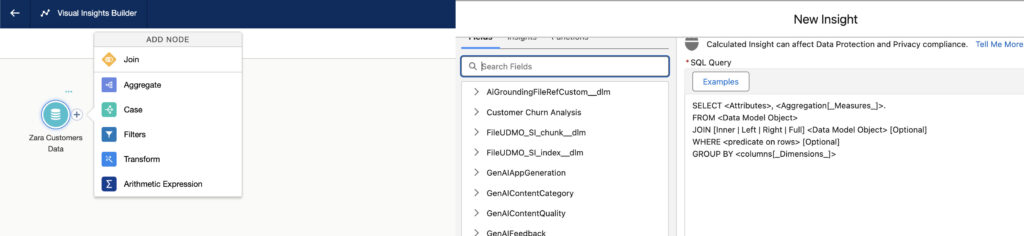
When you look at Salesforce Data Cloud Calculated Insights SQL and its main uses, there are a few key things to understand. Data engineers often use SQL. SQL stands for Structured Query Language. In simple words, it is a way to write rules to combine and summarize large amounts of data. For example, SQL statements can group together years of purchases, support tickets, and website visits. The result is new metrics that are easy to use. This lets businesses see a clear summary of how each customer interacts with their brand over time.

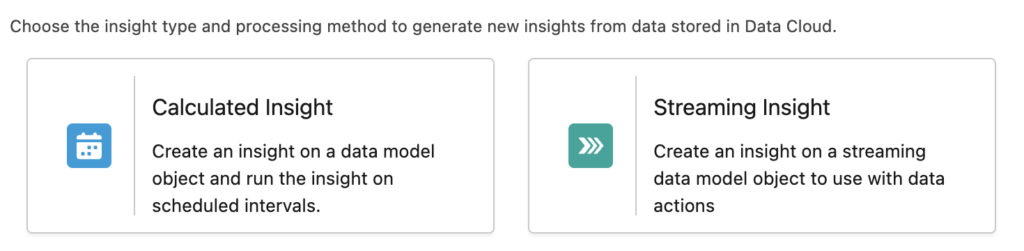
With Calculated Insights, you have two options for creating metrics: using SQL or building them directly in the Segment Canvas.

So, why would you choose one over the other? SQL offers powerful flexibility for complex calculations. However, when you use complex SQL functions, they sometimes create metrics that are non-aggregatable. In simple words, non-aggregatable metrics are summary values that cannot be broken down further. This is where building metrics in the Segment Canvas becomes useful.

For instance, imagine you create a metric in SQL called “Average Order Value.” This metric is calculated by a SQL function that divides total revenue by the total number of orders. Because it’s an average, it cannot be broken down by smaller attributes like individual products or regions without being recalculated. This is a non-aggregatable metric.

If a metric is non-aggregatable, you might notice two things when using the Segment Canvas:

  • It may disappear from your attribute library when you try to use it in certain contexts.
  • It may only allow an “Equal to” filter when building segments, limiting how you can use it.

Using the Segment Canvas to build metrics can help you avoid these issues, ensuring your attributes are flexible and easy to use for audience segmentation. As you use Calculated Insights, keeping these differences in mind will help you plan your segment definitions properly.

calculated-vs-streaming-insights

Common Calculated Insights Use Cases:

  • Customer Lifetime Value (CLV): You can calculate the total amount of money a customer has spent with your brand over their entire relationship. In simple words, CLV is the sum of all purchases a customer makes. For example, if a user shops with you for three years, this metric captures every transaction.
  • Propensity Scoring: Businesses analyze past behavior to predict future actions. For instance, you can estimate the likelihood that a customer will cancel their subscription. This approach is helpful because it lets you intervene early and increase retention.
  • Loyalty Tier Assignment: You can automatically group users into gold, silver, or bronze tiers based on long-term purchasing habits. As a result, customers are rewarded for their loyalty. For example, frequent buyers move into higher tiers and may receive additional perks.

What are Streaming Insights?

So, what happens when you need to know what a customer is doing right now? In this situation, you need a different tool. Streaming Insights are built for immediate, event-driven data. In simple words, they track customer actions as they happen in near real-time.

Streaming Insights do not review years of history. Instead, they focus on data from a short, recent window of time. As data arrives from websites, mobile apps, or outside systems, they process it right away. To manage this fast-moving data, Streaming Insights use time windows. In simple words, a “tumbling window” collects and analyzes fixed periods—such as a 15-minute block. By contrast, a “rolling window” updates constantly, often every minute, as new data comes in. This means businesses can act quickly, reaching users while they are most engaged. Because of this speed, Streaming Insights are especially valuable for handling urgent and time-sensitive events.

So, how do you use Streaming Insights in real-world scenarios? Here are a few Salesforce Data Cloud Streaming Insights use cases and examples, explained in simple words:

  • Cart Abandonment Alerts: A system can spot when a user adds items to a shopping cart but leaves the website without paying. As a result, you can respond quickly with targeted reminders.
  • Location-Based Notifications: When a customer nears a physical store, the system detects their mobile device’s location. At that moment, it can trigger a discount text message, encouraging an in-store visit.
  • Error Monitoring: IT teams can track how many times an error message appears on a website within a five-minute window. This helps them identify system outages early, so they can act right away.

Salesforce Data Cloud Calculated Insights vs Streaming Insights differences

To design a better system, you first need to see where each engine works best. What are their technical boundaries? Most differences come down to two main things: data visibility and cost. For example, one engine connects to more data sources (Calculated Insights). The other focuses only on the latest event as it happens(Streaming Insights). As you read ahead, pay close attention to how your system design choices affect these two areas.

The Hidden Wall of Profile Joins Calculated Insights give you broad access to your customer data. Essentially, they connect directly to Unified Profiles. This means they can view a customer’s name, loyalty tier, and purchase history—all at once. In simple words, you get a complete customer picture in one place.

While Streaming Insights process data quickly, they have a limited view. In simple words, they do not join directly with Unified Profiles. Instead, Streaming Insights only see the event as it happens—not the customer’s full history. For example, if someone clicks a product, Streaming Insights log the click instantly. However, they cannot tell if that user is a VIP member at the same moment. As a result, you might miss important context unless you combine these real-time insights with batch data from Calculated Insights.

Cost and Flex Credits Salesforce Data Cloud tracks your platform usage through Flex Credits. In simple words, Flex Credits are a way to measure how much you use each processing engine. Your choice between Calculated Insights and Streaming Insights has a clear impact on your spending. If you pick the right engine for the right task, you can control costs. If you use an engine for the wrong job, you might spend more than planned.

    • Predictable Costs: Calculated Insights run in scheduled batches. As a result, you can expect more predictable and cost-efficient spending for segment analysis.
    • Continuous Costs: On the other hand, Streaming Insights need constant processing power to monitor events in real-time. This setup is ideal for urgent tasks, but using it for routine jobs can waste resources and drain credits quickly
Calculated vs Streaming Insights in Data Cloud

How to Combine Both for Better Personalization

What is the most practical approach? The most successful organizations do not rely on just one engine. Instead, they use both engines together in a hybrid setup. In this structure, each system has a specific job. Calculated Insights are responsible for analyzing long-term data, which helps with planning and trends. Streaming Insights focus on real-time events and let you act right away. By combining both, you gain context and instant action. This approach enables you to offer better personalization and manage system efficiency and spending at the same time.

When you use these tools together, your Salesforce Personalization integration improves. Calculated Insights provide the context. Streaming Insights offer the instant trigger. To combine their strengths, start with a clear process. For example, use a Decision Layer—such as Salesforce Flow or a Data Action—to coordinate each step. This method connects long-term insights with real-time responses. As a result, your personalization efforts become more focused and timely.

  1. Define the baseline: First, create a Calculated Insight that shows a customer is in the high-value loyalty tier. Do this by using purchase data from the past year.
  2. Catch the signal: Next, set up a Streaming Insight to spot when this customer abandons a cart on your mobile app. This step happens instantly, right after the event.
  3. Trigger the action: Then, use a Data Action to send a personalized email. Offer a 10% discount on the exact items left in the customer’s cart.

This approach lets you shift easily from long-term analysis to immediate action. Each step builds on the one before it. Your data layers work together to create a stronger personalization experience.

In this scenario, the real-time event acts as the spark for action. Historical data, at the same time, helps make each message relevant and personalized for the user. What is the benefit? You get a process that combines instant responses with a deeper understanding of each customer. This approach helps your outreach stand out. As a result, every communication becomes more meaningful and timely.

Next Steps for Your Data Strategy

Success in data management relies on using the right tool for each task. When you need to understand your audience deeply, choose the batch approach of Calculated Insights. This method is efficient for reviewing large amounts of data at set intervals. If you want to quickly respond to short-term changes, use Streaming Insights. This tool helps you catch new events as they happen. Choosing the right engine helps you act quickly and make better decisions.

To keep improving your results, start by examining your current Data Cloud setup. Check if any real-time triggers are running without enough customer context. Review your batch processes as well; if they run too often, efficiency drops and costs can rise. By adjusting these elements, you can improve system performance and reduce expenses. For your next steps, consult the Salesforce documentation on Data Actions and Segment Canvas filtering. These resources guide you through refining your data architecture one step at a time.

Latest blogs

All Blogs